
Investment results
Market conditions
Within the plan, US Equity was the best performer in the second quarter, returning 4.15%. Marketwise, S&P/TSX Composite Index was up 1.10%. S&P 500 index was up 6.32%. MSCI EAFE Index was up 0.66%. The FTSE Canada Universe Bond Index was down 0.69%. The following table depicts the performance of the Plan’s fund (per cent return).
Performance
| Asset class | Market value ($ millions) |
2023 Jul-Sep (%) |
2023 |
2022 Annual (%) |
2021 Annual (%) |
2020 Annual (%) |
2019 Annual (%) |
2018 Annual (%) |
2017 Annual (%) |
|---|---|---|---|---|---|---|---|---|---|
| Fixed income | |||||||||
| Cash and short-term | 78.2 | 1.4 | 3.5 | 1.7 | -0.2 | 0.4 | 1.6 | 1.3 | 0.7 |
| Bonds | 11,776.5 | -7.0 | -3.8 | -16.8 | -1.4 | 11.3 | 10.3 | 0.5 | 3.4 |
| Equities | |||||||||
| Canadian equities | 2,577.8 | -2.5 | 5.4 | -4.6 | 27.1 | 1.6 | 20.4 | -8.3 | 9.3 |
| U.S. equities | 2,788.8 | -1.5 | 9.4 | -10.0 | 24.9 | 15.4 | 23.9 | 3.0 | 14.1 |
| International equities | 2,377.1 | -1.4 | 3.3 | -11.0 | 4.6 | 10.8 | 17.1 | -8.1 | 25.4 |
| Real estate, Private equity and Infrastructure | 8,838.7 | 2.4 | 3.9 | 19.5 | 26.6 | 7.4 | 11.8 | 17.4 | 13.1 |
| Currency overlay | 430.6 | ||||||||
| Currency hedging | -10.2 | ||||||||
| Total (DB component)* | 28,857.4 | -4.1 | -0.1 | -6.7 | 11.3 | 9.4 | 14.7 | 0.9 | 10.4 |
| Benchmark | --- | -4.4 | 1.4 | -11.7 | 8.6 | 10.3 | 15.8 | -1.9 | 8.6 |
Note: Numbers may not add up due to rounding.
Investment highlights
- The fund’s third quarter return was -4.14%.
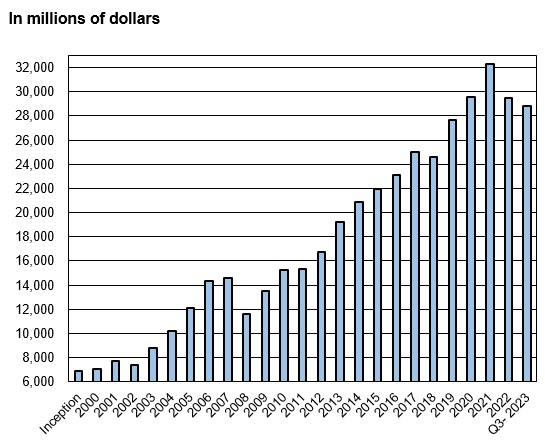
- As of September 30, 2023 the fund held assets of $28.9 billion.
- The fund had net cash outflows of $261.6 million in the third quarter.
- We added $40 million to Bond Overlay, $8 million to Real Estate, $45.7 million to Infrastructure, and $13.4 to Equity Overlay.
- We withdrew $9.1 million from Private Debt, $126.1 million from Canadian Equity, $24.3 from US Equity, $165.0 million from International Equity, $31.5 from Private Equity, and $12.6 from Currency Hedging.
Fund Assets - October 2000 to September 30, 2023
Asset-mix highlights
- As at September 30, 2023, 59.0% of assets were invested in equities and alternative investments compared to the asset mix target of 57%. These investments were within the allowable range and were made up of 8.9% Canadian equities, 9.7% U.S. equities, 8.2% International equities, 15.3% real estate, 7.4% private equity and 7.9% infrastructure.
- 41.0% of assets were invested in bonds and short-term investments, compared to an asset mix target of 43%. This included 9.9% real return bonds, 30.9% nominal bonds, private debt, and bond overlay, and 0.3% in cash, short-term investments, and 0.0% in currency hedging.
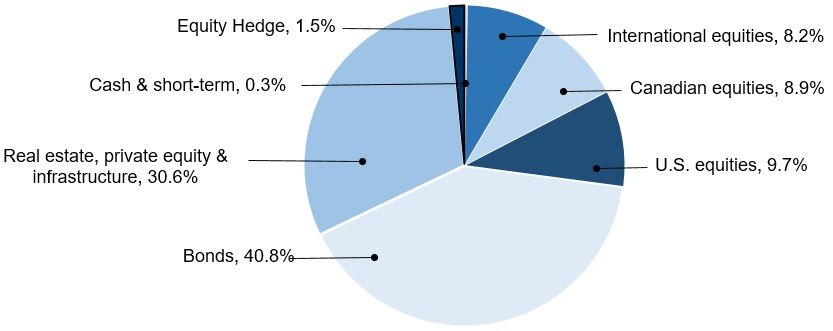
Note: Numbers may not add up due to rounding.